|
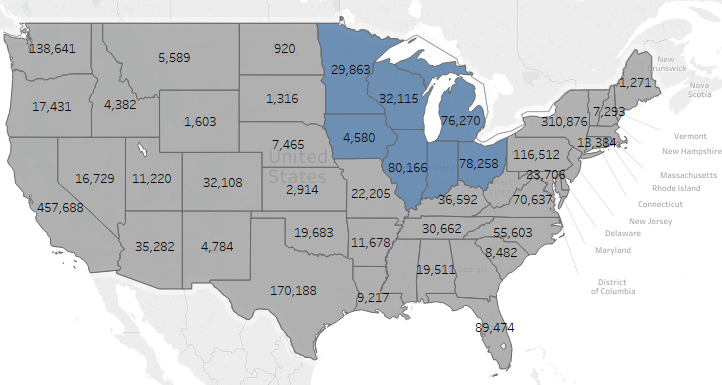
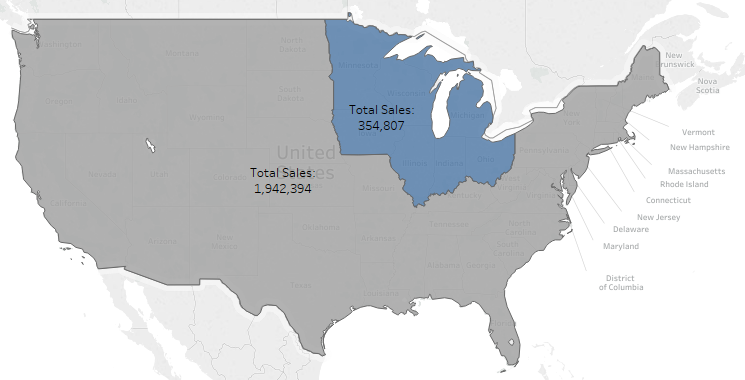
Starting in Tableau 10, users have the ability to create custom territories without having to display the original geographic aggregation. This feature is extremely helpful when the user needs to display aggregated totals on a map. Consider the following use case: a sales manager is responsible for the sales performance of Illinois, Indiana, Iowa, Michigan, Minnesota and Wisconsin. How can the manager quickly see the performance of the group as a whole? In previous versions of Tableau, there wasn't an easy way to display the answer to this question on a map. Using custom territories, users can now remove the State geographic aggregation from the view, which results in an aggregated total for all groups displayed. This allows the sales manager to quickly see how the Midwest region is performing in relation to the remaining total. Users can also create and display multiple custom territories on the same map.
0 Comments
Leave a Reply. |
AuthorWrite something about yourself. No need to be fancy, just an overview. Archives
March 2019
Categories |


 RSS Feed