Sheet Selector in Tableau Desktop
Here's the scenario: You've been asked to display multiple visualizations on a dashboard, perhaps one for profit and one for sales. Easy enough, right? Let's make it a little harder; you only have space for one on your dashboard.
Assuming that nothing else on the dashboard can be removed or resized, a useful tactic is to allow the user to display one visualization at a time in the allotted dashboard space using a sheet select parameter.
An example can be found on the 14ers Dashboard. On this dashboard, the user can select to display either the Elevation Gain Scatterplot OR the Trail Elevation Profile. This is handy as displaying both at the same time would make both graphs unreadable.
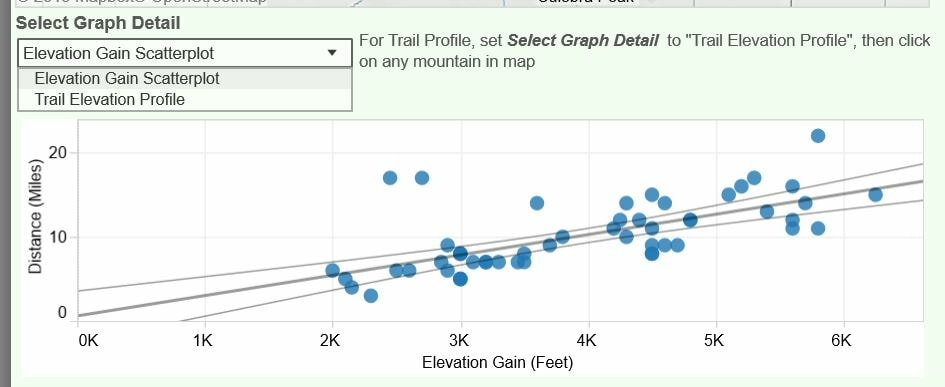
Tableau Sheet Select Parameter
Follow the steps here and give it a try!
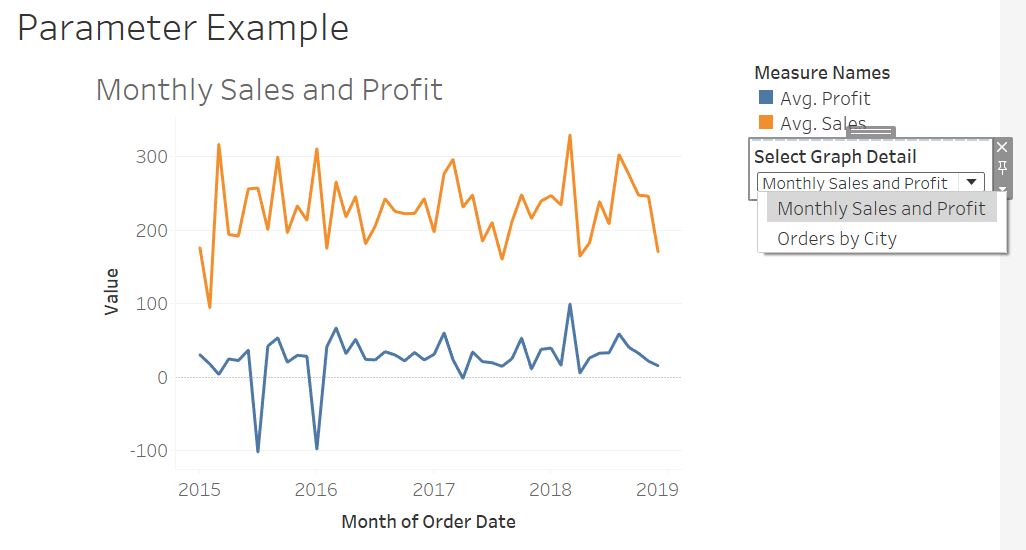
Tableau Sheet Select Parameter